
- Business
- Elections Politics Sentiment
- Entertainment
- Fashion
- FLASH NEWS
- ઈકોનોમી
- કોમોડિટી
- કોર્પોરેટ ન્યૂઝ
- ક્રિપ્ટો
- પર્સનલ ફાઇનાન્સ
- મ્યુચ્યુઅલ ફંડ
- શેર બજાર
FPIs turn net sellers in September 2026 with ₹35,861 crore outflow; Financial Services leads selling

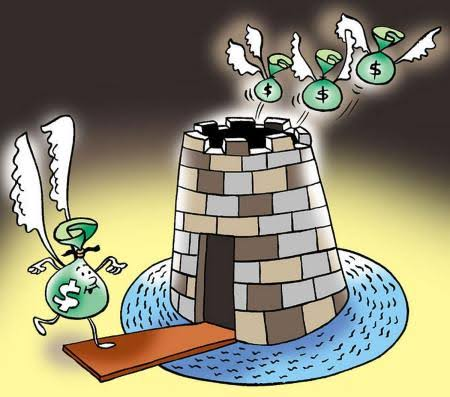
Consumer Services, Services and Healthcare continue to draw foreign capital, PL Capital’s monthly Quant study on sector-wise FPI flows shows
Mumbai, October 9th, 2026: Foreign portfolio investors (FPIs) withdrew a net ₹35,861 crore from Indian equities in September 2026, against net inflows of ₹29,628 crore in August 2026, according to the latest sector-wise FPI/FII flows study by PL Capital (Prabhudas Lilladher). The month ended a two-month run of positive foreign flows in July and August.
Selling in September was broad-based across Financials, Energy, Automobiles and Metals. Financial Services saw the largest outflow at ₹13,147 crore, a sharp swing from inflows of ₹10,494 crore in August and nearly six times its long-term average (LTA) monthly outflow of ₹2,237 crore. Oil, Gas & Consumable Fuels followed with outflows of ₹6,854 crore, more than three times the sector’s LTA outflow, while Automobile & Auto Components saw ₹6,212 crore of selling after inflows of ₹3,106 crore in August.
Telecommunication (₹3,414 crore), Metals & Mining (₹3,003 crore) and FMCG (₹3,001 crore) also recorded notable outflows. Both Telecommunication and FMCG have seen net foreign selling in every month of 2026 so far. Power (₹2,223 crore), Consumer Durables (₹1,905 crore), Capital Goods (₹1,461 crore) and Construction Materials (₹1,205 crore) also saw net selling. Information Technology recorded a relatively modest outflow of ₹998 crore, well within its LTA outflow of ₹2,752 crore.
A handful of sectors continued to attract foreign capital. Consumer Services recorded the highest inflow at ₹2,333 crore, its fourth straight month of positive flows, followed by Services (₹2,302 crore), Healthcare (₹2,117 crore) and Construction (₹1,311 crore). Textiles drew ₹646 crore against a near-flat long-term average. Consumer Services, Services, Healthcare and Textiles each recorded inflows above their long-term monthly averages, with Healthcare inflows at nearly six times its LTA.
On a year-to-date basis, sectoral FPI flows for January–September 2026 remain negative, with cumulative outflows of about ₹2.60 lakh crore. Financial Services accounts for the largest share at ₹1,14,800 crore, followed by Automobile & Auto Components (₹38,560 crore), Oil, Gas & Consumable Fuels (₹37,520 crore), FMCG (₹32,720 crore) and Telecommunication (₹31,550 crore). Metals & Mining (₹16,560 crore), Capital Goods (₹14,020 crore) and Services (₹12,580 crore) have been the key beneficiaries of foreign inflows over the period.
The study’s quarterly view of FII holdings shows a gradual shift in sector weightage. FII weightage in Banks eased to 26.19% in Q1FY27 from 30.21% a year earlier, and in IT to 16.04% from 19.35%. Over the same period, FII weightage rose in Electricals to 17.15% from 13.28%, and in Non-Ferrous Metals to 16.09% from 13.39%.

Commenting on the findings, Mannat Gandhi, Research Analyst – Quant, PL Capital, said: “September marked a clear turn in foreign investor sentiment after two months of inflows, with the selling concentrated in Financials, Energy and Automobiles. At the same time, foreign investors continued to add to Consumer Services, Services and Healthcare, where flows remain well above long-term averages. This points to selective reallocation across sectors rather than uniform selling.”
“The quarterly holding data tells a similar story over a longer horizon, with FII weightage gradually moving away from Banks and IT towards segments such as Electricals and Non-Ferrous Metals. Monthly flows are one input among several, and we would read them alongside earnings and valuations rather than in isolation,” she added.
Sector-wise FPI flows: key movers (₹ crore; negative = outflow)
| Sector | Sep 2026 | Aug 2026 |
| Financial Services | -13,147 | 10,494 |
| Oil, Gas & Consumable Fuels | -6,854 | -1,761 |
| Automobile & Auto Components | -6,212 | 3,106 |
| Telecommunication | -3,414 | -4,983 |
| Metals & Mining | -3,003 | 1,807 |
| FMCG | -3,001 | -1,916 |
| Consumer Services | 2,333 | 8,417 |
| Services | 2,302 | 1,783 |
| Healthcare | 2,117 | 5,931 |
| Construction | 1,311 | 38 |
| Total (all sectors) | -35,861 | 29,628 |
Source: Company, PL Capital Quant research. Converted from INR mn as reported.
(Disclaimer: The information provided here is investment advice only. Investing in the markets is subject to risks and please consult your advisor before investing)
(સ્પષ્ટતા: અત્રેથી આપવામાં આવતી તમામ પ્રકારની માહિતી કોઇપણ પ્રકારે રોકાણ/ ટ્રેડીંગ માટેની સલાહ નથી. બજારોમાં રોકાણ જોખમોને આધીન છે અને રોકાણ કરતા પહેલા કૃપા કરીને તમારા સલાહકારની સલાહ લો. વધુમાં અત્રે પ્રગટ થયેલા કોઇપણ સમાચાર કે વિગતો સાથે businessgujarat.in અંશતઃ કે સંપુર્સણપણે સહમત નથી.)