
PRIVATE PROMOTERS’ SHARE AT 3-YEAR HIGH IN CONTINUING TELLING SIGN OF MARKET BOTTOMING
| MFs AT YET ANOTHER HIGH | FII AT 14-YEAR LOW | LIC AT ALL TIME LOW IN SEPTEMBER QUARTER |
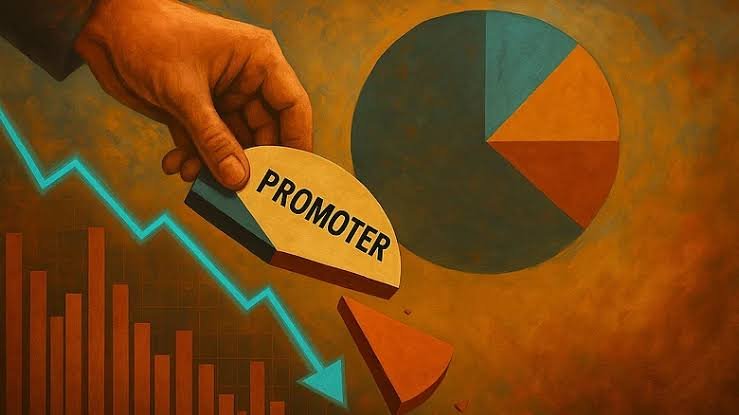
MUMBAI, 11 NOVEMBER: The share of promoters of private sector companies in companies listed on NSE increased further to a 3-year high of 41.93 per cent as on September 30, 2026, as per primeinfobase.com, an initiative of PRIME Database Group, up from a 2-year high of 41.34 per cent as on June 30, 2026. According to Pranav Haldea, Managing Director, PRIME Database Group, as anticipated in our previous quarters report, this is now a continuing telling sign of the market bottoming out. While promoter selling can be due to a wide variety of reasons, promoter buying is always a positive sign.
The share of promoters of private sector companies has increased in the last 2 quarters after having declined in an almost secular manner from December 31, 2021 onward when it stood at 45.15 per cent. While the share of ‘Indian’ private promoters had gone down from 36.89 per cent as on December 31, 2021 to 32.21 per cent as on March 31, 2026, the share of ‘foreign’ promoters had gone up marginally from 8.25 per cent to 8.36 per cent during this period. This has now increased to 32.92 and 9 per cent respectively as on September 30, 2026. These private promoters bought shares worth INR 6,595 crore on a net basis* during the quarter, their fourth consecutive quarter of net buying. In the quarter ending on June30, 2026 they had bought shares worth INR 36,336 crore on a net basis, which was the highest in 4 years.
Meanwhile, the share of Domestic Mutual Funds (MFs) in companies listed on NSE, through which mostly individual investors invest indirectly, reached yet another all-time high of 11.82 per cent as on September 30, 2026, up from 11.58 per cent as on June 30, 2026, the 13th consecutive quarter of increase. According to Haldea, this is a further sign of individual investors being convinced that mutual funds sahi hai (Mutual Funds are the right option). Despite markets being broadly range-bound over the last couple of years, it will be interesting to see if they continue with the faith and pumping in ~INR 30,000 crore on a monthly basis through Systematic Investment Plans (SIPs).
The share of Foreign Institutional Investors (FIIs)^, on the other hand, further declined to a 14-year low of 15.57@ per cent as on September 30, 2026 (from 15.91 per cent as on June 30, 2026).
MFs have continued to narrow the gap with FIIs with the gap in their share declining by another 58 basis points in the quarter ending September 30, 2026 to reach just 3.75 per cent. The gap has more than halved in the last two years alone from 8.09 per cent as on September 30, 2024. At its peak, the gap was 17.14 per cent on March 31, 2015 with FII share at 20.70 per cent and MF share at just 3.56 per cent. According to Haldea, the balance of ownership continues to tilt inward, reinforcing the market’s growing atmanirbharta (self-reliance), with MFs alone set to overtake FIIs in the coming quarters. This trend started with demonetization in 2016, accelerated during Covid years and has further increased in the last couple of years due to geopolitical issues and valuation concerns of FIIs, amongst others. MFs, flush with retail money coming through SIPs, invested INR 1.22 lakh crore during the quarter on a net basis. FIIs too finally became net buyers with inflows of INR 13,970 crore during the quarter (outflow of INR 21,439 crore in secondary market and inflow of INR 35,409 crore in primary market).
With the rise in the share of MFs and also an overall net investment of INR 1.69 lakh crore during the quarter, the share of Domestic Institutional Investors (DIIs)#as a whole, increased to an all-time high of 19.31 per cent as on September 30, 2026, up from 19.16 per cent as on June 30, 2026. This was despite the share of Insurance companies falling from 5.18 per cent to 5.05 per cent during the quarter. Life Insurance Corp. of India (LIC)$ continued to command a lion’s share of investments in equities by insurance companies (at least 67 per cent share or INR 15.49 lakh crore). LIC’s share (across 273 companies where its holding is more than 1 per cent) though decreased to an all-time low of 3.38 per cent as on September 30, 2026 from 3.50 per cent as on June 30, 2026, despite a net buy of INR 7,346 crore during the quarter. Nevertheless, LIC continues to be India’s largest single asset manager with its equity holding being nearly twice the size of the equity holdings of India’s largest Mutual Fund house.
The share of individual investors (retail and High Net Worth Individual (HNI)**combined) increased to 9.50 per cent as on September 30, 2026, up from 9.46 per cent as on June 30, 2026. While the share of retail investors decreased from 7.35 per cent to 7.32 per cent, the share of HNI investors increased from 2.11 per cent to 2.19 per cent during the quarter. Individual investors were net sellers to the tune of INR 26,889 crore during the quarter.
According to Haldea, for years, FIIs had been the largest non-promoter shareholder category in the Indian market with their investment decisions having a huge bearing on the overall direction of the market. This is no longer the case. DIIs along with Retail & HNIs have played a strong countervailing role with their combined share reaching an all-time high of 28.81 per cent as on September 30, 2026. While FIIs continue to remain an important constituent, their stranglehold on the Indian capital market has come down.
DIIs increased their allocation most to Consumer Discretionary (from 16.20 per cent of their total holding as on June 30, 2026 to 16.88 per cent of their total holding as on September 30, 2026) while they decreased their allocation most to Financial Services (28.94 to 28.37). FIIs also increased their allocation most to Consumer Discretionary (15.10 to 16.25) while decreasing their allocation most to Financial Services (33.07 to 31.85).
Finally, the share of the Government (as promoter) decreased to a 3-year low of 8.39 per cent from 8.88 per cent during the quarter. The Government was a net seller to the tune of INR 38,260 during the quarter, through Offers for Sale of LIC, Hindustan Copper and Cochin Shipyard.
There were 21 companies in which the trinity of Promoters, FIIs and DIIs all increased their stake during the quarter these being (in descending order by market capitalisation) Cupid, Thangamayil Jewellery, Gallantt Ispat, CCL Products, Sudarshan Chemical Industries, GMR Power & Urban Infra, Maharashtra Seamless, West Coast Paper Mills, Filatex, Trualt Bioenergy, Gandhar Oil Refinery, Apollo Pipes, Thejo Engineering, Shree Pushkar Chemicals & Fertilisers, Valiant Organics, Shree Vasu Logistics, Kirloskar Electric, Asahi Songwon Colors, Tara Chand Infralogistic Solutions, Bhagyanagar India and Signet Industries.
| * | calculated by multiplying the difference in June and September shareholding by the volume weighted average closing price during the quarter |
| ^ | includes Foreign Portfolio Investors (FPIs), Foreign Direct Investment (FDI), Foreign SWFs and ownership through Depositary Receipts (DRs) held by custodians |
| # | includes domestic MFs, Insurance Companies, Banks, Financial Institutions, Pension Funds, Non-Banking Financial Companies (NBFCs), Domestic Sovereign Wealth Funds (SWFs), Asset Reconstruction Companies (ARCs) etc. |
| $ | LIC’s shareholding details are only available where its holding in a company is greater than 1 per cent |
| ** | retail investors are individuals with up to INR 2 lakh shareholding in a company and HNI investors are those with more than INR 2 lakh holding |
Who is the wisest of them all?
| June 2026 to September 2026 quarter | |||||||
| Rank | No. of companies where holding increased | Average stock price change during the quarter (%) | No. of companies where holding decreased | Average stock price change during the quarter (%) | Change in Average stock price (%) | ||
| 1 | FIIs | 819 | 7.67 | 935 | -2.02 | -9.69 | |
| 2 | GOI (as Promoter) | 0 | 0.00 | 3 | -8.97 | -8.97 | |
| 3 | DIIs | 720 | 5.54 | 759 | -0.63 | -6.17 | |
| 4 | MFs | 526 | 2.93 | 494 | -0.33 | -3.26 | |
| 5 | HNI | 1084 | 2.61 | 902 | 1.22 | -1.39 | |
| 6 | Private Promoters | 222 | 5.38 | 398 | 4.21 | -1.16 | |
| 7 | Insurance Companies | 336 | -0.05 | 419 | 0.71 | 0.76 | |
| 8 | LIC | 44 | -4.82 | 127 | -0.78 | 4.04 | |
| 9 | Retail | 1109 | -3.60 | 1098 | 7.06 | 10.66 | |
Note: This analysis is based on Shareholding Patterns filed by 2321 of the total 2368 companies listed on NSE (main board) for the quarter ending September 30, 2026. As on October 22, 2026, 47 companies were still to file their shareholding patterns. The data coverage is from June 2009 onwards.
(Disclaimer: The information provided here is investment advice only. Investing in the markets is subject to risks and please consult your advisor before investing)
(સ્પષ્ટતા: અત્રેથી આપવામાં આવતી તમામ પ્રકારની માહિતી કોઇપણ પ્રકારે રોકાણ/ ટ્રેડીંગ માટેની સલાહ નથી. બજારોમાં રોકાણ જોખમોને આધીન છે અને રોકાણ કરતા પહેલા કૃપા કરીને તમારા સલાહકારની સલાહ લો. વધુમાં અત્રે પ્રગટ થયેલા કોઇપણ સમાચાર કે વિગતો સાથે businessgujarat.in અંશતઃ કે સંપુર્સણપણે સહમત નથી.)